 Web
Search Intro
Web
Search Intro
Math
Activity
A Webtask
for adult learners
Graphs and charts are ways of representing information visually. For example, what does the graph below tell you?
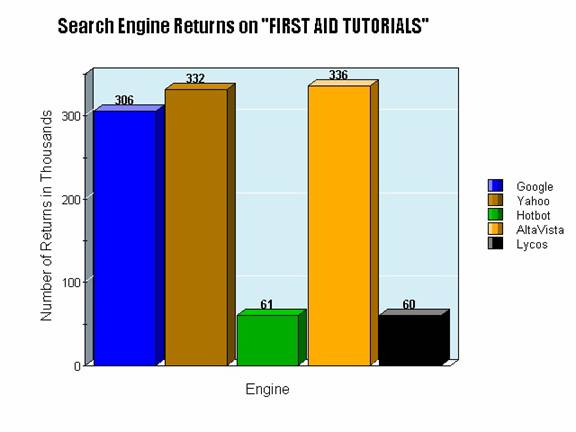
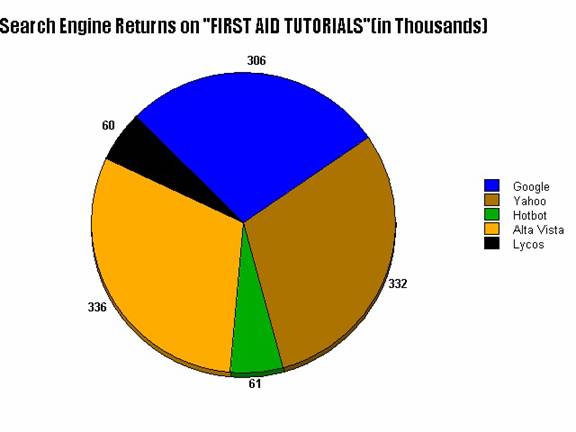
The graph compares Search Engine results on the keywords "First Aid Tutorials" among five Engines (See boxes on your right): Google, Yahoo, Hotbot, Alta Vista, and Lycos.
On the left margin of the chart, you see the words, "Number of Returns in Thousands." Google found 306,000 (in thousands) tutorials. Hotbot found 61,000. What did the others find?
Alta Vista Yahoo Lycos
Examine the very same information in a pie chart, below.
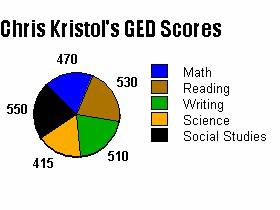
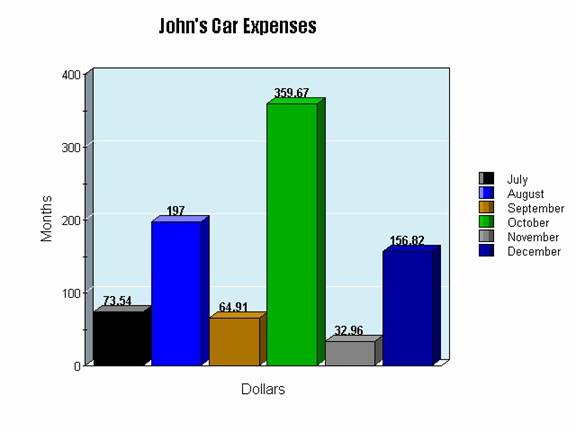
Following are a chart and a graph with different information. Provide answers to the questions using the boxes below.
Chris' highest score area:
Lowest score area:
John's least expensive month Second least Most expensive
Do you think John should sell his car?
When you finish, sign and date your calculation sheets. Print this page with your answers. Place all of you work in your portfolio.(You can create your own graphs at http://nces.ed.gov/nceskids/graphing/ )
Funded by the Colorado Department of Education through the Cortez Adult Education Program. All rights reserved.
©Unlimited Learning, 2004Leecy Wise, author